


 Copy Link
 Share on X
 Share on Facebook
 Share on LinkedIn
Always Active
Required for core functionality such as security, network management, and accessibility. These cannot be disabled.
Build intelligent AI systems that automate decisions, accelerate innovation, and scale business growth.
Design, build, modernize, and scale digital products that drive business growth.
Build secure, scalable, and intelligent platforms that power modern enterprises.
Build intelligent, connected, and autonomous systems that operate in the real world.
Flexible engineering capacity with predictable delivery, ownership, and outcomes.
Uncover the transformative potential of digital and mobile solutions for your industry

 Last Updated: Jul 6, 2026
Apr 2, 2026
Last Updated: Jul 6, 2026
Apr 2, 2026  596
596  30 min. Read


Key Takeaways
Imagine your enterprise has just deployed an LLM-powered product. It sits at the center of a customer-facing workflow. Revenue is tied to it. Six weeks in, response quality starts drifting. A hallucinated output reaches a client. Token costs have tripled with no explanation. The support desk is fielding complaints, but the engineering team has no signal. No alert fired. No dashboard flagged it. No one saw it coming.
This gap is not theoretical. Gartner estimates that at least 30% of generative AI projects will be abandoned after proof-of-concept due to unclear value, poor data, or weak governance. Even among adopters, 74% of companies struggle to scale AI and realize meaningful business value.
Traditional software fails loudly. A server goes down. An API returns a 500 error. A timeout fires. These are clear, binary, and catchable. LLM systems fail quietly. The system stays up, the API responds, the tokens flow, and the output looks plausible right up until it damages something.
LLM observability is the strategic infrastructure that prevents that scenario. It is the capability to understand, in real time, not just whether your AI system is running, but whether it is performing, behaving safely, and delivering value. For enterprise leaders, it is the difference between a production AI system you can trust and one you are simply hoping will behave.
The enterprises winning with AI are not the ones with the best models. They are the ones who can see and improve what their models are actually doing.
This guide is written for organizations making architecture, tooling, and investment decisions around AI systems, including those evaluating or working with a custom LLM development company. It covers the full picture: what LLM observability actually means at an enterprise scale, how to design an architecture that supports it, which metrics matter and why, which tools are worth evaluating, and a phased roadmap for implementing it across your organization.
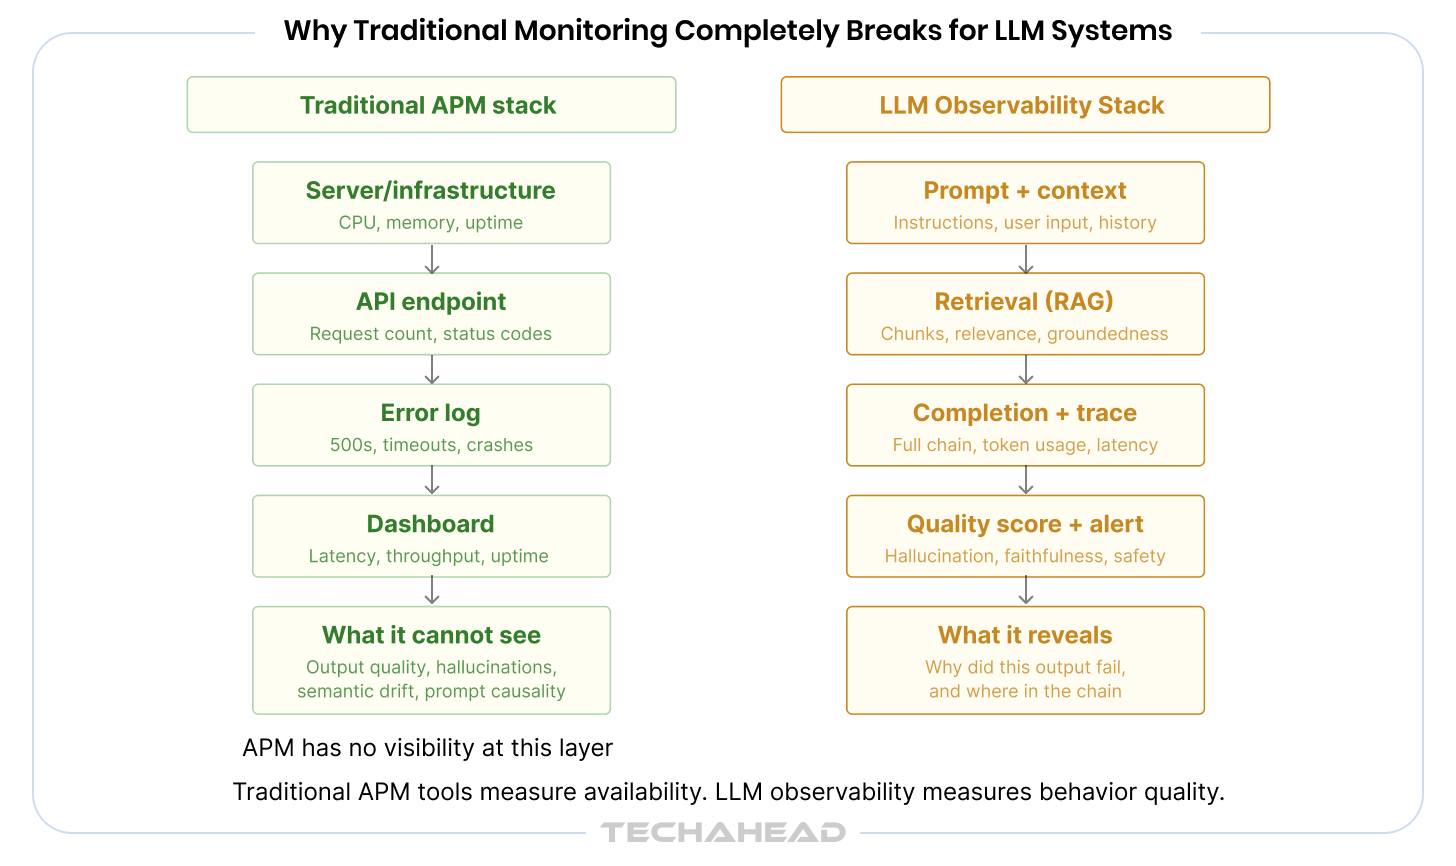
Most enterprises already have monitoring infrastructure. Datadog, New Relic, Splunk, Dynatrace. They track uptime, error rates, CPU utilization, API latency. These tools were built for a world where software behavior is deterministic and failures are binary. They are fundamentally unsuited to the nature of LLM systems.
The problem is not the tools. The problem is the model of what can go wrong.
First, traditional tools measure availability, not quality. An LLM endpoint returning a 200 status code with a hallucinated response is indistinguishable, to a classical monitor, from one returning an accurate and useful answer. Uptime is the wrong metric when the question is: is this response actually correct?
Second, they have no concept of semantic drift. A model that worked well three weeks ago can begin to perform differently after a prompt template change, a retrieval index update, or a model version rollout. Classical monitoring captures none of that. There is no error rate to track when the output changes are subtle and gradual.
Third, they cannot trace prompt-to-output causality. When something goes wrong in a multi-step AI pipeline, a classical trace tells you which service was slow. It does not tell you whether the problem originated in a poorly constructed prompt, a retrieval step that returned irrelevant context, or a model that was passed an instruction it misinterpreted. That level of diagnostic visibility requires purpose-built LLM logging and tracing.
The risk compounds in enterprise environments. A single unmonitored LLM layer can corrupt every downstream decision it influences, whether that is a customer service response, a document summary, a credit recommendation, or a compliance review. By the time the failure surfaces as a business problem, it has already propagated through multiple layers of consequence.
This is why implementing observability in AI systems requires an entirely different mental model, one built around quality, causality, and behavioral consistency rather than availability and throughput.
Observability, in classical distributed systems engineering, is the ability to infer the internal state of a system from its external outputs. Applied to LLM systems, that definition sharpens considerably.
LLM observability is the capability to understand why your AI system behaves the way it does, not just that it behaved. It answers the diagnostic questions that matter: Why did this output contain an error? What in the chain caused the latency spike? Where did the retrieval step fail to surface the relevant document? Which prompt variation is producing safer, more accurate responses?
Classical observability is built on three pillars: logs, traces, and metrics. Those pillars still apply in LLM systems, but their meaning expands significantly.
| Pillar | Classical Definition | LLM Definition |
| Logs | Server events, errors, request records | Prompt logs, completion logs, retrieval logs, tool call logs, agent decision logs |
| Traces | Request path through distributed services | Full chain traces across multi-step agent workflows with prompt-to-output causality |
| Metrics | Latency, error rate, throughput, uptime | Output quality, token cost, hallucination rate, safety compliance, user satisfaction |
Monitoring tells you something went wrong. Observability tells you why it went wrong, and where in the chain it originated. This distinction is architecturally significant. A monitoring-only approach requires you to anticipate every failure mode in advance and build dashboards for it. An observability-first approach equips your team to investigate failure modes you did not anticipate, because the system captures enough context to reconstruct what happened.
For enterprise AI systems operating in dynamic, high-stakes environments, that difference is not academic. It is the difference between a team that debugs in minutes and one that debugs in days.
LLM performance monitoring fits within this larger picture as the real-time operational layer: the dashboards, alerts, and threshold checks that surface known failure patterns. Observability is the foundation beneath that, the raw material that makes monitoring meaningful.
Architectural decisions made at this stage are difficult to reverse once a system scales. A well-designed LLM observability architecture positions your organization to catch problems early, evaluate performance continuously, and govern AI outputs in a way that satisfies both your engineering team and your risk function.
The following framework represents a production-grade approach to LLM observability architecture that can be adapted to your existing stack and organizational structure.
Observability is not a feature you add after deployment. It is a design decision you make before the first line of production code is written.
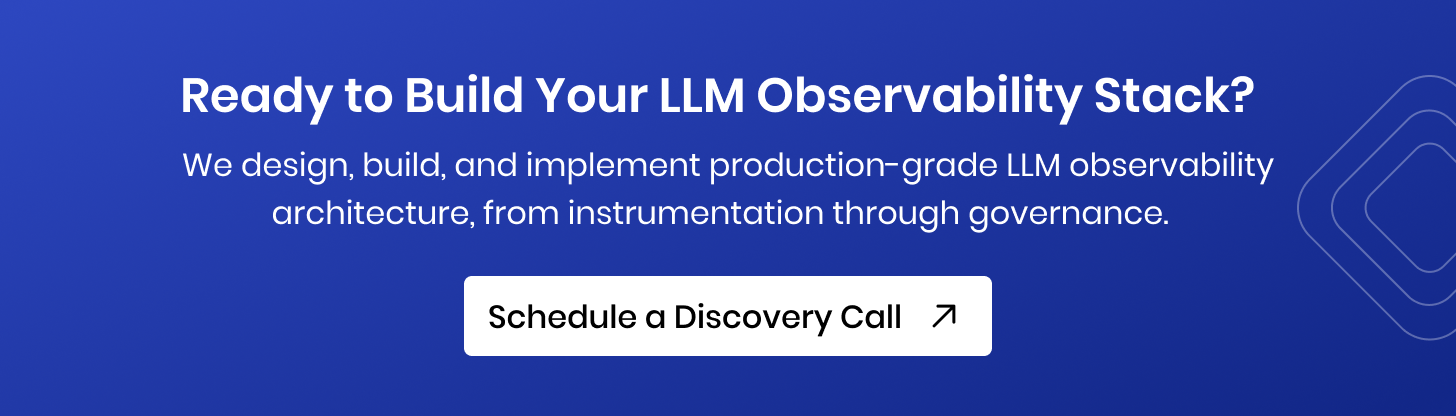
Instrumentation is where observability begins. The principle here is straightforward: capture everything that matters at every LLM call boundary. In practice, that means instrumenting prompts and completions, retrieval steps in RAG-based systems, tool and function calls made by agents, agent decision trees and branching logic, and session-level context threading.
The most common mistake at this layer is logging only the output. That approach tells you what the system said but nothing about why it said it. Effective LLM logging and tracing requires capturing the full context: the system prompt, the user input, any retrieved documents, the model version, the temperature settings, and the full completion. Correlation IDs should thread every step together so that any output can be traced back to the exact inputs that produced it.
The guiding principle at this layer is: capture intent, not just output. The intent, meaning the full context and instructions the model was given, is what makes the output interpretable.
Once instrumentation is in place, the monitoring pipeline defines how that data flows, gets processed, and surfaces as actionable signal. The architecture of this pipeline has significant implications for latency, cost, and the quality of the insights it produces.
A well-designed LLM monitoring pipeline moves data through five stages: instrumentation capture, ingestion and normalization, storage optimized for LLM telemetry, evaluation and scoring, and then alerting and dashboard delivery.
The critical design decision here is synchronous versus asynchronous evaluation. Synchronous evaluation runs quality checks before or during the response delivery, adding latency but catching issues in real time. Asynchronous evaluation scores outputs in a background pipeline, adding no latency but operating with a delay. Most enterprise deployments use a hybrid: lightweight, low-latency checks synchronously and deeper semantic evaluation asynchronously.
At scale, trace sampling strategy matters. Capturing every token from every request across a high-volume deployment is expensive and often unnecessary. A tiered sampling approach, where routine interactions are sampled at lower rates and high-stakes or anomalous interactions are captured completely, balances cost with coverage.
This is where LLM observability diverges most sharply from traditional software monitoring. The evaluation layer is responsible for answering the question that uptime metrics cannot: is this system actually doing its job well?
A production LLM evaluation framework operates on two tracks simultaneously. Online evaluation runs automated scoring against live traffic, flagging outputs that fall below quality thresholds in near real time. Offline evaluation runs deeper, more computationally intensive analysis against sampled outputs on a batch basis, often incorporating human review for high-stakes domains.
The most valuable aspect of the evaluation layer is its feedback loop function. Every scored output, whether it passes or fails evaluation, is data that can be used to improve the system: to refine prompts, adjust retrieval strategies, select better model variants, or identify gaps in the knowledge base. Without this layer, LLM systems operate open-loop, meaning they execute without any mechanism to learn from their production behavior.
For enterprise deployments in regulated industries, this layer also serves a compliance function. The ability to demonstrate, with evidence, that outputs are being evaluated for accuracy, safety, and policy compliance is increasingly a requirement rather than a best practice.
The governance layer is what transforms observability from a technical practice into an enterprise capability. It covers how the system communicates failures, who has visibility into which parts of the system, and how organizations demonstrate accountability over their AI outputs.
Alert design at this layer should be mapped to specific failure modes rather than generic thresholds. A hallucination rate spike requires a different escalation path than a latency breach. A policy violation requires a different notification chain than a cost anomaly. Threshold-based alerting, where fixed limits trigger alerts, should be supplemented with anomaly-based alerting that surfaces unusual behavioral patterns even when absolute thresholds are not exceeded.
Immutable audit trails are a non-negotiable element for any enterprise operating in a regulated industry. The ability to reconstruct, exactly, what an LLM system output on a given date, in response to a given input, under a given configuration, is a legal and compliance requirement in financial services, healthcare, and legal services contexts, and is becoming standard expectation across most enterprise sectors.
Role-based dashboards ensure that the right stakeholders see the right signal. A CTO needs a system health overview and trend lines. An ML engineer needs granular trace data and evaluation scores. A compliance officer needs policy violation rates and audit trail access. A CFO needs cost-per-task and token utilization trends. Observability infrastructure that serves all those audiences from a single data layer is what justifies its investment at the enterprise level.
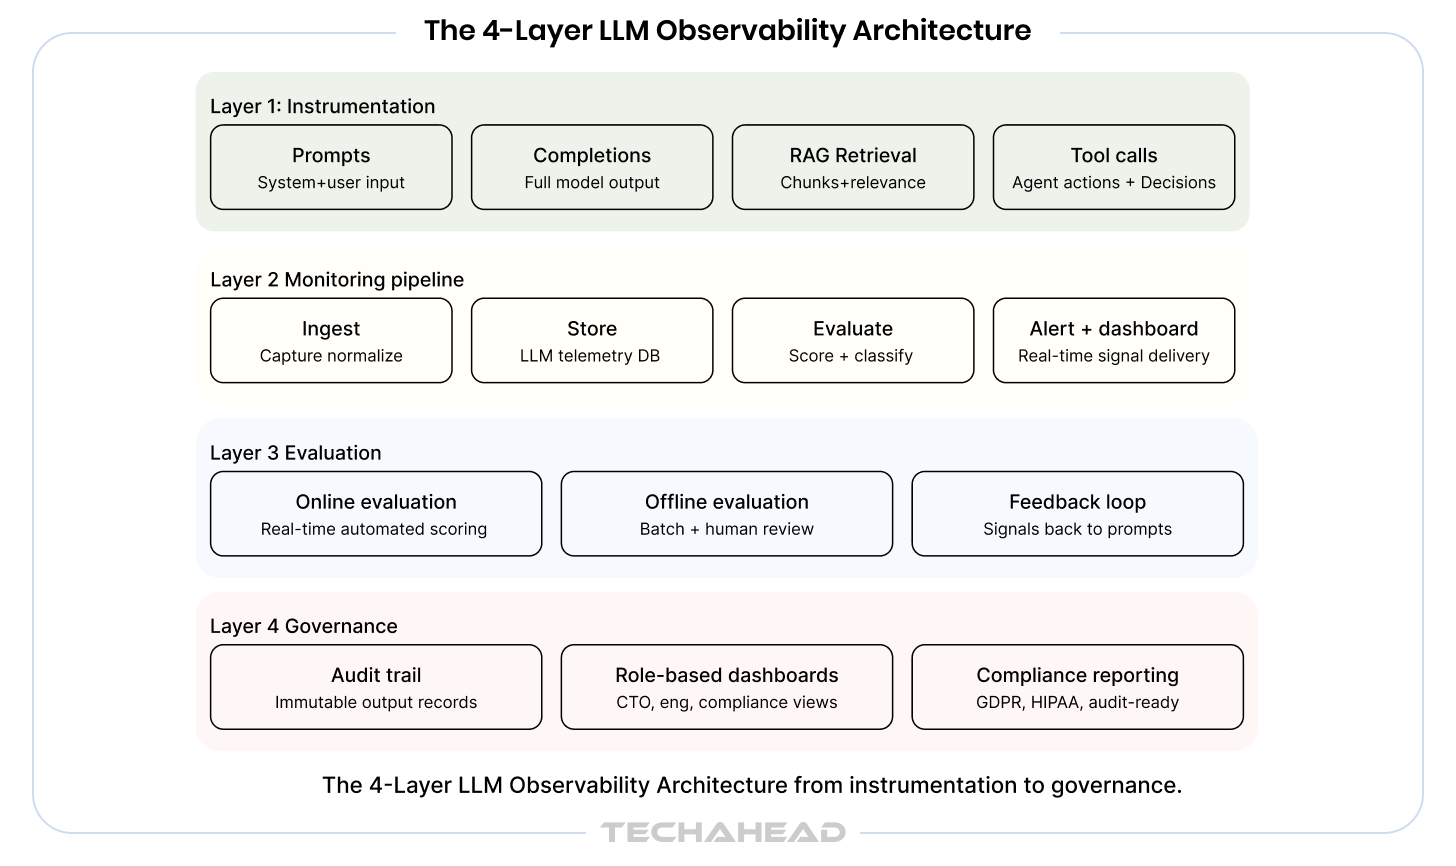
One of the most useful tools for enterprise leaders making investment decisions is a clear framework for assessing where their organization currently stands and what the path forward looks like. The following maturity model maps the journey from no observability to a fully governed, continuously improving LLM system.
| Stage | Name | What It Looks Like | Business Risk | What Is Missing |
| 1 | Blind | LLMs in production with no observability infrastructure | Critical: failures are invisible until they become incidents | Everything |
| 2 | Reactive | Basic error logging, manual output review on complaints | High: problems are caught after damage is done | Proactive detection, automated evaluation |
| 3 | Instrumented | Structured logs and basic performance metrics in place | Medium: visibility exists but quality is not measured | Evaluation layer, feedback loops |
| 4 | Observable | Full pipeline with automated quality evaluation and alerts | Low: most failure modes are caught and investigated | Governance layer, compliance infrastructure |
| 5 | Optimized | Closed feedback loops with continuous improvement cycles | Minimal: system improves from its own production behavior | Nothing critical |
Most enterprises that have been running LLM systems for six to eighteen months sit at Stage 2 or Stage 3. They have basic logging but no systematic evaluation. They review outputs reactively, usually after a customer complaint or an internal audit flags a problem. The gap between Stage 3 and Stage 4 is where the most significant risk reduction happens, and it is also where the investment requirement is highest.
Stage 5 is not a destination so much as an operating posture. It is characterized by feedback loops where evaluation data actively informs model selection, prompt refinement, and retrieval strategy on a continuous basis. It is the state in which an enterprise’s AI systems demonstrably improve over time rather than simply operating at a fixed level of quality.
Self-Assessment Prompt
Ask your team: If an LLM system in production started delivering subtly inaccurate outputs today, how long would it take you to detect it? If the answer is hours, you are likely at Stage 3. If the answer is days, you are at Stage 2. If the answer is ‘we are not sure,’ you may be at Stage 1. The time-to-detection question is the fastest diagnostic for your current maturity stage.
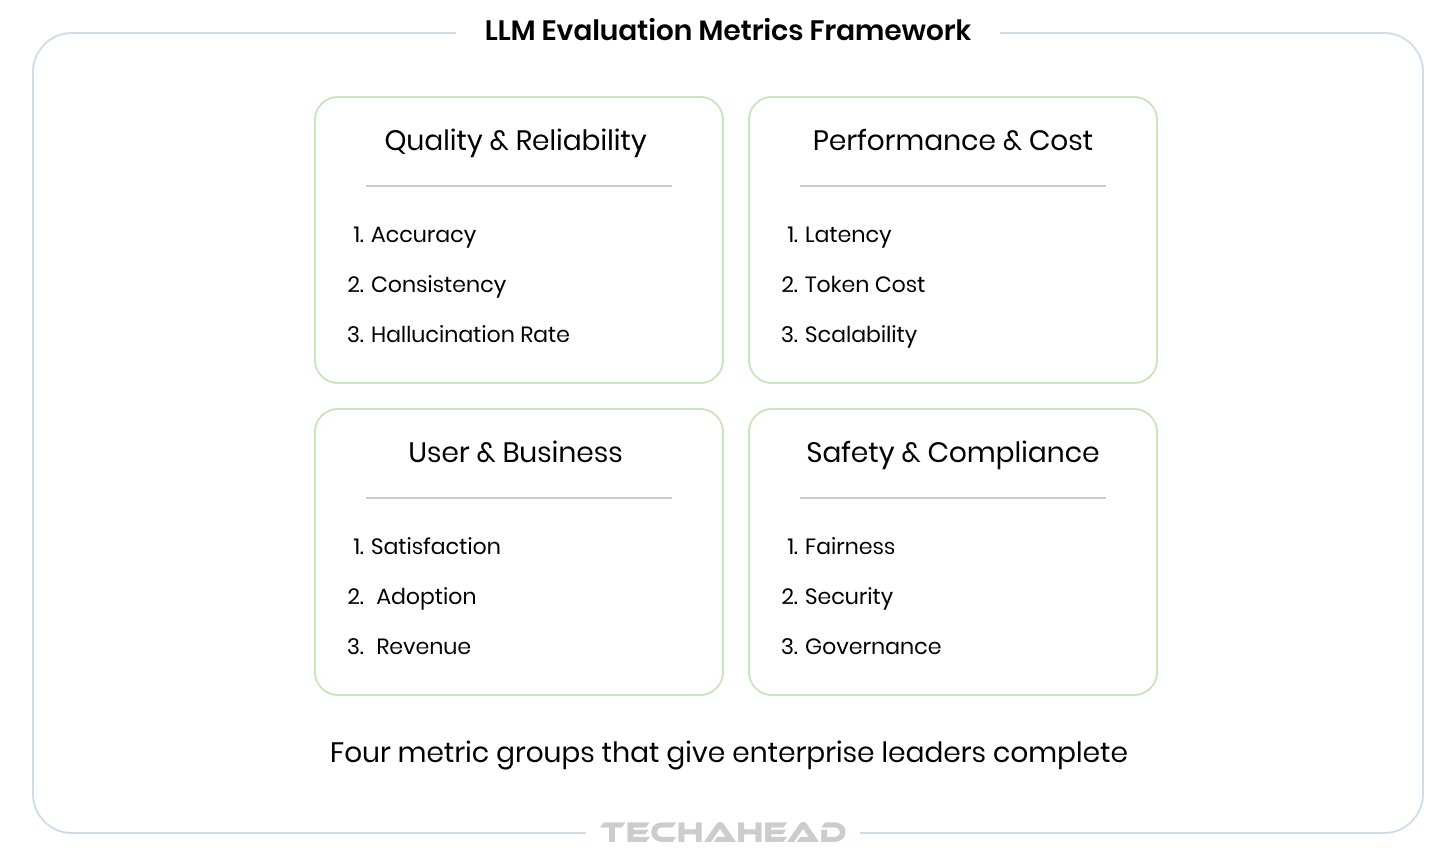
The metrics landscape for LLM systems can feel overwhelming. Academic benchmarks, evaluation libraries, and platform-native scoring systems each offer dozens of signals. The practical question for enterprise leaders is simpler: which metrics, if tracked consistently, give you sufficient confidence in system behavior to make decisions?
The following framework organizes LLM evaluation metrics into four groups, each corresponding to a different organizational stakeholder and business concern.
These are the metrics that tell you whether the system is producing outputs that are accurate, grounded in evidence, and safe to deliver to end users. They are primarily the domain of the ML engineering team but should be reported upward as a system health signal.
These metrics close the loop between AI system behavior and business outcomes. They are the signals that belong in leadership dashboards alongside traditional product KPIs.
For enterprises operating in regulated industries, or any organization where AI outputs can create legal exposure, these metrics are not optional.
Note: Conduct AI readiness assessment to review organizational capability for AI implementation.
The tooling market for LLM performance monitoring has matured rapidly over the past eighteen months. There are now purpose-built platforms, open-source frameworks, and enterprise APM extensions all competing for the same position in the LLM observability stack. The challenge for enterprise decision-makers is not finding tools. It is evaluating them on dimensions that matter for enterprise deployment.
| Tool | Best For | Key Strengths | Enterprise Fit | Limitations |
| LangSmith | LangChain-native teams | End-to-end tracing, prompt versioning, dataset management | Strong for LangChain stacks | Less flexible outside LangChain ecosystem |
| Arize AI | Enterprise ML + LLM observability | Drift detection, embedding monitoring, production-grade alerting | High: built for enterprise scale | Pricing scales with volume |
| Helicone | Cost and usage monitoring | Lightweight integration, per-request cost tracking, caching | Medium: strong for cost focus | Limited deep evaluation capability |
| Braintrust | Evaluation-first workflows | Offline evaluation pipelines, dataset versioning, human review integration | High: strong governance features | Newer platform, smaller ecosystem |
| TruLens | RAG quality measurement | Open-source, feedback function library, RAG-specific scoring | Medium: best as part of custom stack | Requires engineering investment to operationalize |
| RAGAS | RAG evaluation frameworks | Faithfulness, answer relevancy, context recall metrics | Medium: specialized for RAG pipelines | Evaluation only, not full observability |
| Datadog LLM Observability | Teams already on Datadog | APM-native, unified dashboard, anomaly detection | Very High: enterprise infrastructure already in place | LLM features still maturing vs. dedicated tools |
| OpenTelemetry + LLM Plugins | Custom monitoring pipeline builds | Vendor-neutral, highly extensible, broad ecosystem support | High: best foundation for custom stacks | Requires significant engineering to configure |
| Traceloop | Agentic and distributed systems | OpenTelemetry-native, strong agent tracing, broad model support | High: well-suited for complex agent pipelines | Smaller community than established platforms |
| New Relic AI Monitoring | Broad enterprise APM with LLM support | Unified observability platform, mature enterprise features, AI response quality tracking | Very High: enterprise-grade platform | LLM depth still expanding; best for teams already on New Relic |
Build when your use case involves genuinely proprietary data flows, non-negotiable data residency requirements, or observability needs that existing tools cannot serve. Custom LLM monitoring pipeline builds also make sense when your AI infrastructure is unusual enough that off-the-shelf tools require more adaptation than building from scratch would.
Buy when speed-to-production is the primary constraint, when your stack aligns with a leading platform’s native integrations, and when your team’s engineering capacity is better spent on the AI product itself than on observability infrastructure.
Integrate is the approach that most mature enterprises eventually converge on: an open-source foundation such as OpenTelemetry for instrumentation and RAGAS for RAG evaluation, wrapped with an enterprise-grade platform for dashboards, alerting, and governance. This approach avoids vendor lock-in while still benefiting from the product investment of dedicated observability platforms.
Want to know the best route for enterprise AI adoption? Read our blog Build vs Buy vs Partner to strategically make the most consequential call for your AI initiatives.
The architectural and tooling decisions above can feel abstract without a concrete implementation path. The following roadmap structures the work into four phases that respect enterprise procurement cycles, change management realities, and the practical constraints of teams that are simultaneously building and operating AI systems.
The implementation path above is straightforward in principle. In practice, several predictable failure patterns derail otherwise well-designed observability programs. The following six are the ones we see most consistently.
| Pitfall | What to Do |
| Treating observability as a one-time setup | Build observability as a living system that evolves as models, prompts, and use cases change. Schedule quarterly observability reviews. |
| Monitoring outputs only | Instrument the full chain: prompt construction, retrieval quality, context assembly, and completion. Output-only monitoring misses most root causes. |
| Aggressive sampling in production | Use tiered sampling: lower rates for routine interactions, full capture for high-stakes, anomalous, or complaint-associated interactions. |
| Siloing observability from the building team | Observability must be co-owned by the team building the system. Data that engineering cannot access or act on provides no value. |
| Conflating LLM performance monitoring with infrastructure monitoring | LLM performance monitoring measures output quality and business impact. Infrastructure monitoring measures compute health. Both are necessary, and neither substitutes for the other. |
| Skipping governance until a compliance incident forces it | Governance infrastructure is cheaper to build proactively than to retrofit under regulatory pressure. Build it in Phase 4, not Phase 6. |
Every investment in observability infrastructure needs to be justified against a business return. For the 1,200+ global brands and Fortune 500 enterprises TechAhead, a leading AI development company, has partnered with since 2009, that return operates across four dimensions simultaneously.
TechAhead’s AI systems are built under SOC 2 Type II certification and GDPR and HIPAA compliance frameworks from day one. Hallucination detection metrics, safety compliance tracking, and PII exposure monitoring are engineering decisions we embed at the architecture stage, not features added after deployment.
As an AWS Advanced Tier Partner with Security Services Competency, TechAhead designs LLM monitoring pipelines on cloud-native infrastructure built for performance and cost governance at scale.
Ranked #1 globally in Clutch’s Spring 2025 App Development Awards, our engineering approach is built on the principle that speed and reliability are not a tradeoff — they are both products of instrumented, observable systems.
Recognized as a Top Generative AI Company and Most Reviewed AI Company across both the US and India by Clutch and The Manifest, TechAhead brings 16 years of production-scale engineering to LLM observability engagements.
LLM observability for enterprise is not a feature that gets added to a mature AI system. It is a foundational capability that determines whether the system can ever become mature. Organizations that invest in it early build AI systems that improve over time, that surface problems before they become incidents, and that can be operated and governed with the kind of confidence that enterprise deployment demands.
The organizations that are building durable AI capabilities are the ones who treat LLM observability for enterprise as a first-class architectural priority, not an afterthought, and not something to revisit after the first production incident.
The maturity model, the architecture framework, and the tooling landscape presented in this guide are all actionable starting points. The first question to answer is the self-assessment one: where is your organization today, and what is the cost of staying there?
Observability is not overhead. It is the operational backbone of any LLM deployment worth trusting at enterprise scale.

LLM observability is the capability to understand why an AI system behaves the way it does in production, not just whether it is running. For enterprise organizations, it matters because LLM systems fail in ways that traditional monitoring cannot detect: silently, semantically, and often with significant downstream business consequences before any technical alert fires.
Traditional monitoring measures system availability, error rates, and infrastructure performance. These are binary and predictable. LLM observability measures output quality, behavioral consistency, semantic accuracy, and safety compliance. These are probabilistic and context-dependent. The two practices serve different diagnostic purposes and require different tooling and methodologies.
The most important metrics vary by use case, but the universal starting point is: hallucination rate, groundedness score, latency metrics (particularly Time to First Token), token cost per task, and task completion rate. Safety and compliance metrics become primary for regulated industry deployments. The LLM evaluation metrics framework should map each metric to a specific business risk or operational objective.
There is no single answer, because the best tool depends on your existing stack, your team’s engineering capacity, and your compliance requirements. Datadog LLM Observability and New Relic AI Monitoring are the strongest choices for teams already invested in those platforms. Arize AI and Braintrust are purpose-built for enterprise-scale evaluation. OpenTelemetry with LLM plugins provides the most flexibility for teams building custom pipelines. Most enterprises end up with a combination of two or three tools covering instrumentation, evaluation, and governance respectively.
A foundational implementation, covering structured logging, basic metrics, and a monitoring pipeline, can be achieved in four to six weeks for a team with the right engineering resource allocation. A full implementation including evaluation, automated quality scoring, and governance infrastructure typically takes four to six months depending on the complexity of the AI system and the organization’s existing data infrastructure.
The cost operates on three dimensions: the direct cost of failures that go undetected, including hallucinated outputs, policy violations, and inefficient token usage; the velocity cost of debugging without observability data, which multiplies engineer time significantly; and the regulatory cost of being unable to demonstrate governance over AI outputs when audited. For most enterprises, the combined cost of operating without observability exceeds the investment required to build it within twelve months of deployment.
We use cookies to ensure our website functions properly, improve performance, and provide a personalized experience. You can choose which types of cookies to allow below.
Required for core functionality such as security, network management, and accessibility. These cannot be disabled.
Help us understand site traffic and user interactions so we can improve performance and usability.
Enable enhanced functionality and personalization such as language or region preferences.
Used to deliver relevant ads, track campaign performance, and measure advertising effectiveness.