


 Copy Link
 Share on X
 Share on Facebook
 Share on LinkedIn


Always Active
Required for core functionality such as security, network management, and accessibility. These cannot be disabled.
Build intelligent AI systems that automate decisions, accelerate innovation, and scale business growth.
Design, build, modernize, and scale digital products that drive business growth.
Build secure, scalable, and intelligent platforms that power modern enterprises.
Build intelligent, connected, and autonomous systems that operate in the real world.
Flexible engineering capacity with predictable delivery, ownership, and outcomes.
Uncover the transformative potential of digital and mobile solutions for your industry

 Last Updated: May 11, 2026
Mar 27, 2020
Last Updated: May 11, 2026
Mar 27, 2020  16062
16062  11 min. Read


Testing the performance of an app before its launch is an essential process after mobile application development, not only to avoid the fallout of dealing with performance issues but also to prevent additional costs incurred in rectifying the errors. Launching an app without testing can not only result in a business loss but also opportunity loss. Top mobile app development companies conduct multiple rounds of testing, covering unit, integration, system and acceptance testing, among others. Load Testing is among the most critical of these tests as it helps to assess the performance and capability of an app to handle the estimated user load.
There are several tools available in the market for load testing. The most widely used are JMeter, WebLOAD, NeoLoad, Loadster, Load Impact, and Load Runner. Apache JMeter is an open-source testing tool that is trusted for its reliable performance. The benefits of Apache JMeter is that it is easy to set up and use and also supports multiple protocols for testing. It can be run on a single machine, on multiple devices in a distributed environment, or by using docker on the cloud. For a small load, JMeter can be used in GUI mode, whereas for bigger loads, the non-UI mode can be employed with distributed or cloud environments.
The Workload model serves as a guide to determine the amount of load that needs to be mimicked on the server for checking the app’s performance. For instance, if there is already one live system that is receiving 1000 hits per second at its peak time, then the workload model is prepared based on the existing system’s data. In the same situation, load testing can be scheduled in such a way that JMeter creates 3 to 5 times more load than the existing system is receiving.
In other words, if currently, the server is getting 1,000 hits/second, then the model should target generating 3,000 to 5,000 hits/second on the server to test the app’s performance. However, the load is just one of the variables to be considered when designing the workload model. While several other variables are also a part of the workload model, the primary test described above is the minimum that one should follow for determining proper load generation.
After the creation of the workload model, the next step is to prepare a load test scenario and use-case, which can later be converted into a test script. For instance, the basic feature of a mobile app may be to provide a search for properties in the city and book an appointment to visit a property at a scheduled time. Additionally, the app may have several other features. In this case, the most used features are the property search and appointment booking to visit the property. Thus the scenario created can be – “search property by its name and book appointment for viewing that property”. So, the use case will be “A verified user logs into the system with valid credentials; he/she searches a property and books appointment for viewing it”.
Accordingly, while qa testing, all the APIs which are performing these tasks can be used in the test script. Usually, it will include Login, Search Property, Schedule Visit, etc. The performance tester can get details of these APIs from the API signature doc for preparing the load script.
The setup of JMeter is incredibly easy. The first step is to download the latest version of JMeter and extract the zip file in the local system.
Now, JMeter can be run on Windows by double-clicking on jmeter.bat file inside the bin folder of JMeter. If the JMeter folder is in F:\drive, then the following path should be followed to start JMeter.
F:\apache-jmeter-5.2.1\bin
After locating the jmeter.bat file, double-click on it. JMeter will launch in GUI mode with some information on the console. Read the information on the console carefully, as it says to use non-UI mode for a larger load testing along with updating the java heap size in jmeter.bat file.
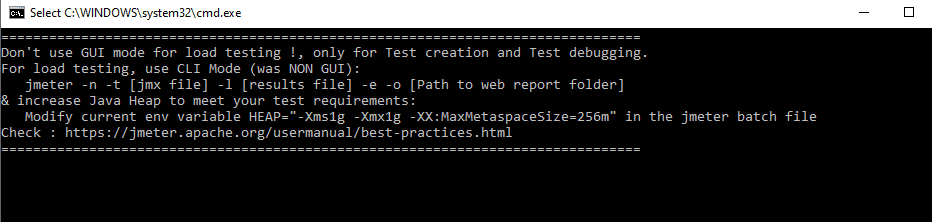
UI mode of JMeter is used to write test script and for debugging. Additionally, it is possible to perform low user count load testing as well.
The load test script should be developed in JMeter in GUI mode. One can either choose to record for preparing the script or write it manually. In recording mode, https requests are not recorded. Therefore, it is better to create a load script manually by using various built-in features of JMeter like Thread Group, User Parameters, Co-relation, Timer, CSV Data Set Config, JSON Extractor, and Listener.

The above image shows a load test plan scenario.
Thread Group is the first item to add while creating a load test plan in JMeter. It is used to define the user load along with ramp-up time and loop count.
The ramp-up period (seconds) tells JMeter the amount of time for creating the total number of threads. If the ramp-up period is left unspecified, i.e., ramp-up is zero, JMeter will create all the threads immediately.
The below screenshot shows that the total user count taken for the load testing is 30,000; ramp-up time is 100 seconds (i.e. 30,000/100 = 300 users will be created per second); and, loop count will be 1.

User Parameters can be added to the test plan, as shown below:
Test Plan > Add > Preprocessors > User Parameters (This is used to pass the parameter values into the test plan during the test run).

Here we have given ‘type’ as the variable name and ‘https’ as its value. Similarly, ‘baseURL’ as the variable name and its value as ‘api.xxxx.com’. These parameter variables can be further passed to each Http sample request.
Co-relation is a concept for storing a value in a variable and further passing that variable into the next Http request as an input parameter.

In the above screenshot we can see that the variables stored in ‘User Parameters’ are passed into ‘Protocol [http]’, ‘Server Name or IP’, and in ‘Path’ fields.
Http request sampler ‘Post Login’ has used the concept of co-relation to store the value of access token which will be received after a successful response from the server. This access token value will be stored in a variable defined in ‘JSON Extractor’. The user can add this as:
Post Login > Add > Post Processors > JSON Extractor

Now, this variable ‘access token’ which occurs as a response of ‘Post Login’ sampler can be passed to the next request as an input value, since the access token is a mandatory field for retrieving the data from the server.
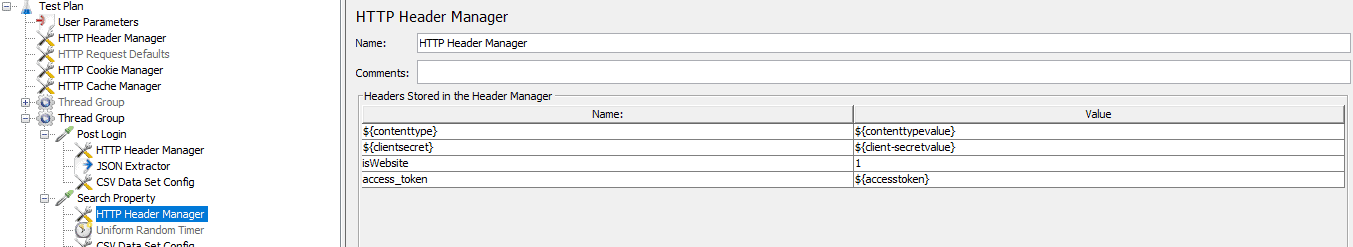
The above image shows that the variable ‘access token’ is passed into the ‘HTTP Header Manager’ of the ‘Search Property’ sampler.
This can be used to provide test data during load testing in a CSV format. It can be added as:
Http Sampler (Post Login) > Add > Config Element > CSV Data Set Config
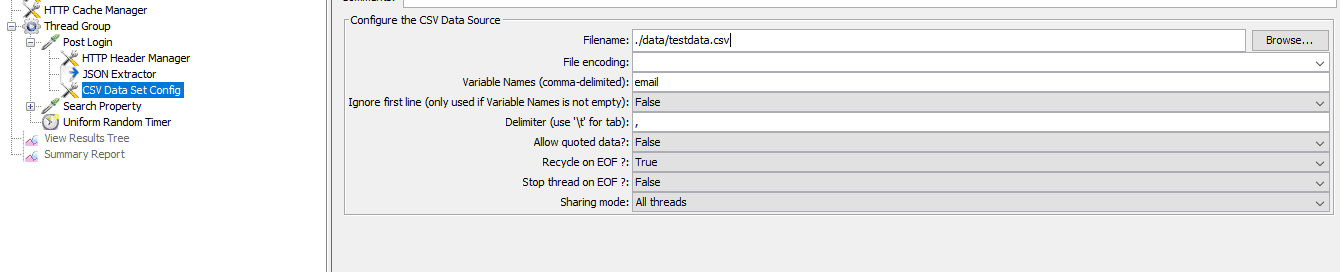
The relative path of the test data CSV file should be used by creating a folder inside the JMeter bin directory. For example, the folder can be renamed ‘data’, and the CSV file can be placed inside the data folder. If the name of the test data file is ‘testdata.csv’ then the Filename can be provided as ‘./data/testdata.csv’.
Listeners are critical during the debugging of the script. They will show whether the prepared script is working fine or if there are issues that need to be corrected. ‘View Result Tree’ listener can be used during load test script writing for debugging.
Listeners should be used for debugging only. They should be disabled while executing the load test since their UI elements consume a lot of the system memory.

The timer is used to keep the load script in synchronization with the time taken by the Http sampler to send a request on the server and get a response.
‘Uniform Random Timer’ is a useful inclusion in the load test script. It can be added as:
Test Plan > Add > Timer > Uniform Random Timer.

It takes two values Constant Delay, which is a fixed wait time, and Random Delay, which can be used if the response could not be received within the Constant Delay time duration.
By including all the above components, it is possible to create a proper load test script to perform the load qa testing of mobile apps.
Non-UI mode of execution is preferred over UI mode for any load testing activity. It consumes fewer system resources, thus ensuring that the maximum resources are assigned to JMeter to perform the functions properly. Below are the steps for running the test in non-UI mode:
A. Save the load test plan (script) in the machine at this location – F:\ loadscript\loadtest.jmx
B. If the test result needs to be saved, then create a path for storing the result. For example, if the test result should be saved at – F:\ loadscriptresult, then create the test result file name as ‘loadtestresult.jtl’; thus result file path will be – F:\ loadscriptresult\loadtestresult.jtl
C. Thus, the command for running the load test in non-UI mode will be –
jmeter -n -t F:\ loadscript\loadtest.jmx -l F:\ loadscriptresult\loadtestresult.jtl
For linux/mac machines the command will appear as:
sh jmeter -n -t /home/loadscript/loadtest.jmx -l /home/loadscriptresult/loadtestresult.jtl
D. To execute the load test by using the command mentioned in step C, open the command prompt in windows (or terminal in Mac), go to the bin directory of the JMeter folder, paste the command and press the enter button. The below information will be seen on the command prompt if the test starts successfully.

After successful test execution, a beautiful dashboard report can be generated from the saved result file. The below command can be used to generate the report:
jmeter -g F:\ loadscriptresult\loadtestresult.jtl -o F:\loadscriptresult\loadtestresult\20users
Here, ‘F:\ loadscriptresult\loadtestresult.jtl’ is the result file path and ‘100users’ is the name of the folder where the dashboard report will be generated. Now, open the ‘100users’ folder and double click on the index.html file to see the dashboard report.

Note: The dashboard report shows ‘Apdex’ score as 0.951, which is very good. The maximum value is 1, and the lowest value is 0. Therefore, a score close to 1 is considered to be good for a performance report.
There are several other report parameters to analyze in the report. The most important ones are Active thread over time, hits/seconds, Response time percentiles, Response time overview, etc.
Also Read:
Top 10 Automation Testing Best Practices to Enhance Efficiency
Load Generator machine configuration
It’s imperative to select a proper machine for load generation (where the JMeter script will run). A regular laptop/computer with 8 GB RAM and Core i3 CPU can generate load for up to 3000 virtual users. For load generation requirements for 10000 and above users, the cloud will be the better option rather than several small distributed physical systems.
Also, assigning proper heap size on the Jmeter file is essential; i.e. approx 80% memory should be allocated to heap before starting the load testing. The load test for heavy load should always be executed in JMeter non-UI mode with all listeners in disabled mode.
In the above scenario, we have successfully generated load for 10000 virtual users with a VM with 16 vCPU and 64 GB RAM (OS – Linux).
In today’s digitalized world, seamless user experience is a crucial feature for any app as delays in response time can cause the user to lose interest. Given this scenario, performance testing is an essential process during development to ensure that the app can efficiently manage sudden increases in load.
At TechAhead, our team of app development experts conducts load testing with JMeter as an essential part of the app development process to ensure that our clients can capitalize on getting to the app store on time and without subsequent fallouts.
TechAhead, a leading mobile app development company is known to deliver high quality mobile apps for all platforms and frameworks. Contact our experts now to take your business to the next level.
We use cookies to ensure our website functions properly, improve performance, and provide a personalized experience. You can choose which types of cookies to allow below.
Required for core functionality such as security, network management, and accessibility. These cannot be disabled.
Help us understand site traffic and user interactions so we can improve performance and usability.
Enable enhanced functionality and personalization such as language or region preferences.
Used to deliver relevant ads, track campaign performance, and measure advertising effectiveness.