


 Copy Link
 Share on X
 Share on Facebook
 Share on LinkedIn


Always Active
Required for core functionality such as security, network management, and accessibility. These cannot be disabled.
Build intelligent AI systems that automate decisions, accelerate innovation, and scale business growth.
Design, build, modernize, and scale digital products that drive business growth.
Build secure, scalable, and intelligent platforms that power modern enterprises.
Build intelligent, connected, and autonomous systems that operate in the real world.
Flexible engineering capacity with predictable delivery, ownership, and outcomes.
Uncover the transformative potential of digital and mobile solutions for your industry

 Last Updated: May 11, 2026
Apr 2, 2024
Last Updated: May 11, 2026
Apr 2, 2024  4195
4195  8 min. Read


Key Takeaways
Maximize your React app’s potential with the React Developer Tool. In the following guide, we’ll break down exactly how to utilize this essential tool for effective debugging and optimization. Expect hands-on tips for setup, performance profiling, and workflow integration, enhancing your React App Development from the get-go.

Unlock advanced debugging capabilities for your React applications with React Developer Tools. What makes this Chrome extension a true game-changer is its ability to provide insights into the component tree structure, state, and props of your React apps.
But how do you get this magical tool in your hands? It’s simpler than you think!
Navigate to the extension page, select ‘Add to Chrome’, and follow the installation prompts to add the React Developer Tools to your Chrome browser.
This guide presumes you are familiar with create-react-app, Chrome DevTools, and concepts like state and props within components. To install React Developer Tools, simply follow these steps.
Enter ‘React Developer Tools’ into your browser’s marketplace search bar to easily find the extension. After the installation process, you’ll see the React Developer Tools icon – a blue symbol displayed next to the browser’s address bar. This icon is your indicator that the extension has been successfully added to your browser.
To open the treasure trove that is React Developer Tools, simply open Chrome Developer Tools and click on the Components tab.
Welcome aboard!
The beauty of React Developer Tools is that it’s not exclusive to Chrome. You can install it on Firefox browsers as well.
To do this, download and install the extension from your browser’s extension marketplace. Once installed, you’ll see the icon in the upper-right section of your browser.
Not a fan of browser extensions? No worries! You can also install the react-devtools package globally or as a project dependency with yarn or NPM. The power to choose is in your hands!
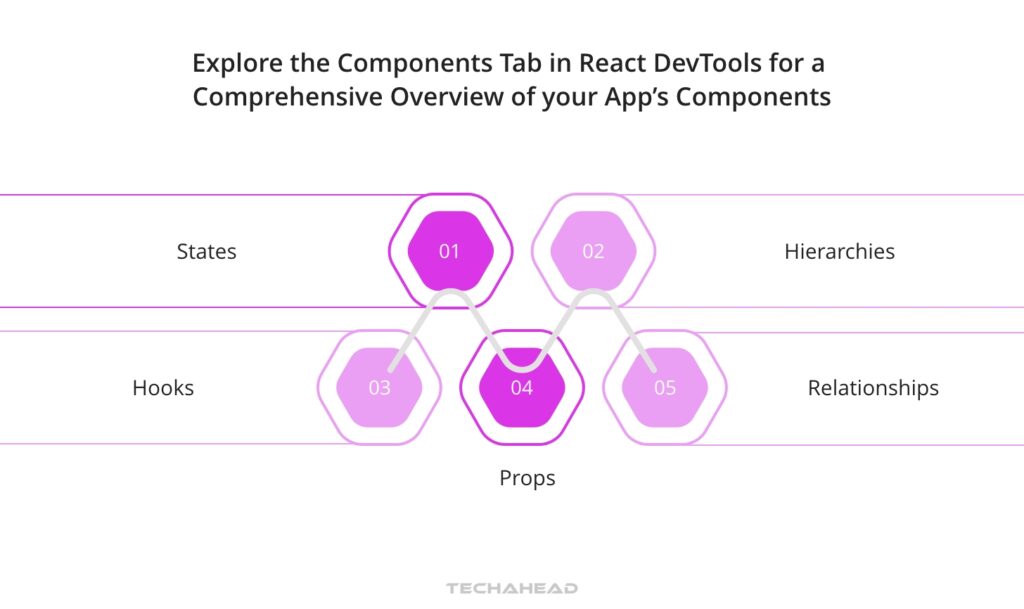
Consider the Components tab in React DevTools as your map to the world of React components. It provides an actionable overview of your React app components, detailing:
Think of it as your magnifying glass, allowing you to view the intricate details of your React application’s component structure and flow.
The Components tab allows you to scrutinize the component tree of your React application, including the hierarchy, props and state, and other associated information.
This comprehensive overview empowers developers to navigate and comprehend the component hierarchy effectively, making identification and resolution of issues a breeze.
Consider the Components tab in React DevTools as your compass, guiding you through the component hierarchy.
It displays the root react components and their subcomponents, enabling you to view the rendered component tree on the page.
Want to select an element on the page? Simply use the arrow icon in React Developer Tools, which highlights the corresponding component in the component hierarchy.
The Components tab offers more than a map; it presents a wealth of information. When you select a component from the hierarchy, React Developer Tools display the component’s current props, state, and hooks in the right-hand side panel, which you can also edit.
This level of detail facilitates a deeper understanding of your components, aiding in efficient debugging and optimization.
React Developer Tools, also known as react dev tools, equips you to fine-tune your React apps, much like a skilled mechanic optimizes a car. The Profiler tab, accessible with a single click, allows you to monitor performance and measure the rendering time of each component in your application.
You could view the Profiler tab as a stopwatch. It records and analyzes information about your application’s performance, including rendering times, helping you understand component updates.
It provides information on what caused a component to render, whether it was parent component rendering or prop changes, and can visually highlight every component’s update using the ‘Highlight updates when components render’ setting.
This enables you to optimize your React application’s performance by identifying components that take longer to render and filter commits using the Profiler’s threshold settings to focus on potential bottlenecks.
React DevTools automatically tracks performance information during each render of your application once the profiler recording begins, akin to monitoring a vehicle’s performance during a race.
The React Profiler groups performance information by ‘commits’, with each bar in the bar chart representing a single commit.
Using React DevTools to identify and tackle performance bottlenecks is key to optimizing your React application.
The flame chart in React DevTools visually represents the rendering time of components and their children, where the width and color of the bars indicate how long and impactful each render is during a commit.

Armed with React Developer Tools, you’re on the path to professional-level debugging. The React Developer Tools Extension enables you to inspect the React component tree, view and modify component props, state, hooks, and more, offering a comprehensive toolset for in-depth component inspection.
React Developer Tools serves not only as an inspection tool but also facilitates interaction. Within the Components tab, you can modify a component’s state and props in real-time by accessing and updating them from the right-side panel.
Despite the power and versatility of React Developer Tools, it’s not immune to issues. There are known issues with Chrome v101 and earlier, where the extension may fail to load React Elements in the Components tab.

While powerful as a standalone tool, React Developer Tools becomes a formidable part of your debugging arsenal when coupled with other dev tools.
Other extensions, like Redux DevTools and MobX Developer Tools, can enhance React Developer Tools by providing advanced features for debugging state changes in applications using Redux or MobX, respectively.
Despite its vast capabilities and compatibility with different browsers, React Developer Tools unfortunately does not currently support mobile browsers.
The power of React Developer Tools is not limited to itself. By integrating with tools like Redux DevTools and Reactotron, it provides a more comprehensive debugging experience.
Beyond React apps, React Developer Tools also caters to React Native, enabling inspection and debugging on both iOS and Android platforms. This makes debugging React apps a seamless process for developers.
React DevTools must be included in the project’s development dependencies to use it with React Native.
When inspecting React Native applications, there are a few best practices to keep in mind. React Native developers can employ React DevTools to inspect the component hierarchy, enhancing understanding of component structuring within applications.
Upgrade your React project using developer tools like ESLint, Prettier, and React Developer Tools, much like a mechanic utilizes the right tools to enhance a vehicle.
Kickstarting a new React project with React Developer Tools from the outset can be transformative.
Beyond new projects, React Developer Tools proves to be an invaluable developer tool for existing apps as well.
As we’ve seen, React Developer Tools is an invaluable companion for any React developer.
React DevTools is a Chrome extension that allows you to inspect and debug React applications, providing insight into the component hierarchy, state, and performance. It helps analyze your app’s structure and provides detailed performance analysis.
To enable Developer Tools in React, add the react-devtools package to your project using npm install –save-dev react-devtools, then add “react-devtools” to the scripts section in your package.json, and run npm run react-devtools from your project folder.
After that, you can open the React Developer Tools through Chrome DevTools (View > Developer > Developer Tools). These two tabs, Components and Profiler, will be available on sites using React.
You can use CodeSandbox as a popular tool for ReactJS development, which allows you to start new projects easily and automates tasks like bundle building and dependency management.
Yes, you can use React Developer Tools with React Native to inspect and debug components on iOS and Android platforms.
You can enhance React Developer Tools with additional tools like Redux DevTools, MobX Developer Tools, and Reactotron to enable advanced debugging of state changes. This allows for a more comprehensive approach to monitoring and troubleshooting your application.
We use cookies to ensure our website functions properly, improve performance, and provide a personalized experience. You can choose which types of cookies to allow below.
Required for core functionality such as security, network management, and accessibility. These cannot be disabled.
Help us understand site traffic and user interactions so we can improve performance and usability.
Enable enhanced functionality and personalization such as language or region preferences.
Used to deliver relevant ads, track campaign performance, and measure advertising effectiveness.